

Most businesses are sitting on a goldmine of data, and doing very little with it. Spreadsheets pile up, reports take hours to compile, and by the time someone actually reads the numbers, they’re already out of date. That’s where custom digital reporting dashboards come in. Instead of chasing data across five different platforms, you get a single, real-time view of what’s actually happening in your business. At AGR Technology, we build reporting dashboards tailored to how your business works, so your team can stop guessing and start making informed decisions, fast.
Get in touch to see how we can help streamline your business operations with smart data solutions
Reviews from our happy clients:

Justine Brummans
Alessio is both incredibly knowledgeable and personable! He gave me great advice that was catered to me and my situation. Thank you Alessio! Super helpful!

Springfield Equestrian Park
Alessio is amazing! I can not speak highly enough of how helpful and knowledgeable he is, my website he created far exceeded my expectations, he is so accomodating and I can only wish him every success with his business. I rate AGR technology 10 out of 10.
Legacy Energy
We used AGR Technology and dealt with Alessio to design and build our website as well as host our emails. Alessio was a pleasure to deal with and had plenty of ideas that we could implement into our site. He has a great attention to detail, he is also very polite in understanding our goals and what we wanted to achieve with our website.
Thanks mate,
Alex & Rob
Excellent Service
Alessio developed our website for our business and has done a wonderful job. He is very personable and knowledgeable. We have enjoyed working with him. We will be referring others to him and highly recommend him to those who need Tech advice.
MRC Performance
I have been in business for over 10 Years and recently moved to AGR Technology for all our IT needs. They are able to fix nearly anything remotely and always very helpful in recommending appropriate hardware upgrades that do the job as required but not costing more than needed.

Alessio provided an excellent service. He was very dedicated in his method of finding solutions to problems. He continued to try different avenues until he found the reason as to why a particular application was not working. He was very knowledgeable in his understanding of the internet and of applications and how they work, and he was able to apply this knowledge in understanding how to resolve the obstacles that continued to appear. He is understanding towards his client's needs and goals and he is willing to work with his client in achieving those goals. He is a very polite and well mannered person and very calm and gentle in his approach. I would highly recommend Alessio's services to anyone.

Palmira Rigoli
Great work ethics Alessio! We at Totally Gluten Free Products are very happy to have you on board as our IT and SEO master. Very reliable, trustworthy and knowledgeable in the field.
YouTube Comment

Nat's Custom Designs
Alessio from AGR Technology has recently helped me create a website for my business.
Throughout the whole process from start to finish Alessio made the process easy for me, by calling me and explaining each step of the way. I'm not very computer savvy, but with Alessio taking the time to explain in detail everything I needed to know from putting inventory in to having it shipped. He even remotely joined my computer to help guide me through everything.
He's very knowledgeable and is experienced in everything I needed and if there was anything else I needed to know that wasn't something he was familiar with, he researched it.
I would HIGHLY recommend Alessio to anyone. He has not only helped me for now but I know that if I ever needed help with anything else he would definitely go above and beyond to help. Thank you so much for everything you have done. It's been a long process but well worth it 🙂
Byron Macumber
AGR Technology is amazing. not only do they stick with you through out the process, they also accommodate to your wants and needs. They are efficient in their work and they have high integrity. Their capabilities are shown through their website design, and appropriate knowledge of utilities regarding software. over the many years of working with them they have been fantastic. I would recommend to everyone
Very helpful
Alessio was thorough, diligent and kept me updated at all time points. I was very impressed with his performance, passion and dedication. I will continue to use his services.
Wantrup & Associates
Alessio of AGR Technology is an IT guy we rely on whenever we need IT help. His professionalism impressed us right at the first time. He solved many of our IT problems in no time. Excellent communication and speedy response.
We highly recommend this company
From a happy customer
Valeria Bianco
I received AGR contact information from a previous client, who had found their service excellent. So I contacted AGR with some expectations, and I can say they exceeded them. Professional, honest, punctual, reliable, their service is faultless. We can't recommend them highly enough.
Very fast, value for money and a comprehensive service
AGR is professional, organised and very skilled at what they do. They take the initiative, looking after all the details that you would not have thought of to enhance your website presence, marketing funnel and automated appointment bookings. Big bonus - pricings are at a fraction of the cost of competitors.
Customer testimonial
Alessio from AGR Technology is wonderful at gently guiding the less technically savvy users to solve problems. Back up service excellent. Highly recommended
SEO for website
The team is very cooperative and delivers clean and very efficient work.

Raimond Volpe
Nothing but good things to say about Alessio. He has been great service and great at communicating with me by both phone and email. Very good knowledge and problem-solving ability with our web development. I would thoroughly recommend Alessio and AGR Technology to anyone wanting online marketing or web development
Website design
Big thank you to Alessio at AGR Technology for a smooth and easy website development process. Nothing was to difficult to accomplish, I can highly recommend his first class service.
Proudly supporting clients of all sizes to succeed through digital solutions













Why work with us?






What Is a Custom Digital Reporting Dashboard?
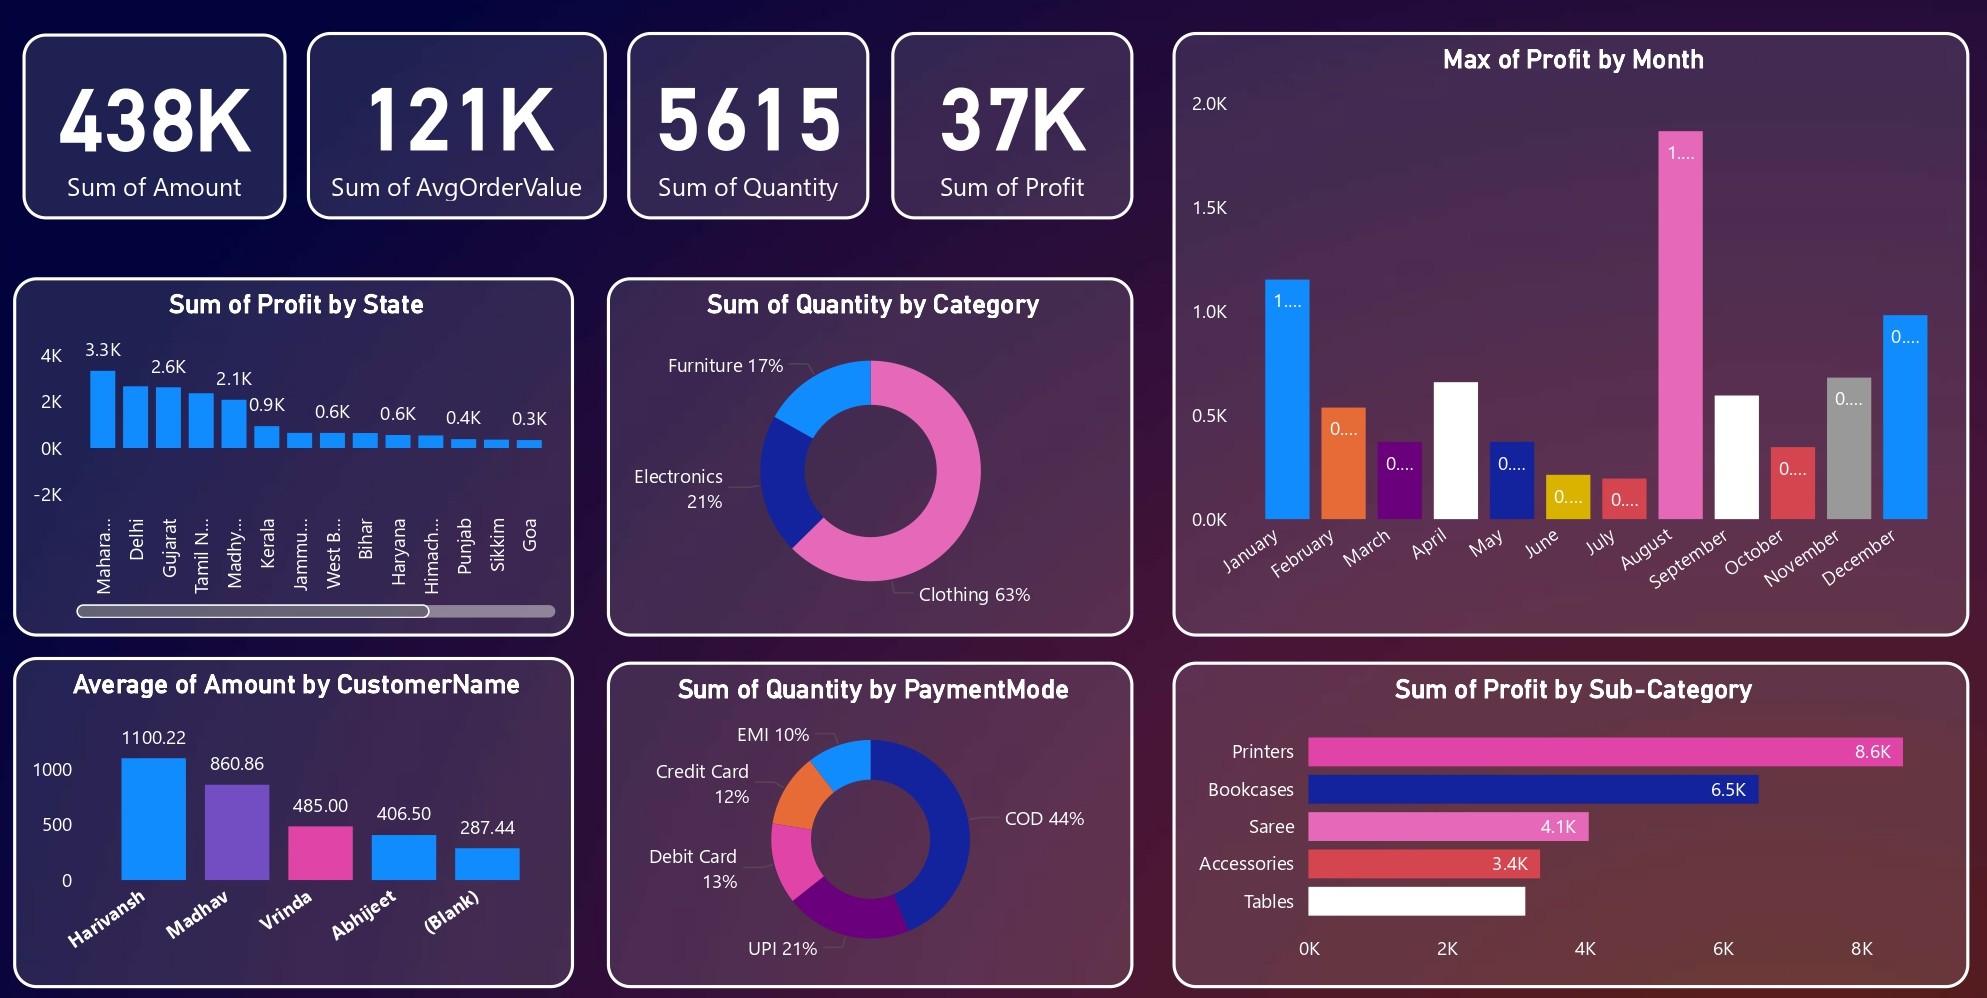
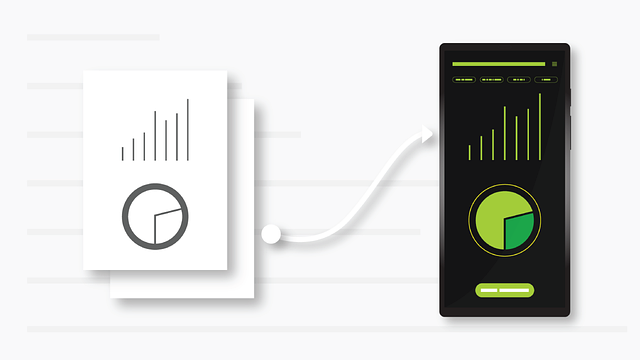
A custom digital reporting dashboard is a visual interface that pulls data from multiple sources, your CRM, accounting software, ad platforms, eCommerce store, or internal databases, and presents it in one centralised view. Unlike off-the-shelf tools that give you a fixed template, a custom dashboard is built around your specific KPIs, workflows, and reporting needs.
Think of it this way: a generic dashboard might show you pageviews and revenue. A custom one shows you revenue by product category, by sales rep, by region, updated in real time, with alerts when a metric drops below a set threshold.
Businesses use custom dashboards to monitor:
- Financial performance, cash flow, profit margins, budget vs. actuals
- Sales pipeline, lead volume, conversion rates, deal velocity
- Marketing ROI, cost per acquisition, channel performance, campaign results
- Operations, fulfillment rates, inventory levels, SLA compliance
- Customer data, satisfaction scores, churn rates, lifetime value
The goal is simple: give the right people the right information at the right time, without digging through reports manually.
Key Benefits of Custom Dashboards Over Generic Solutions
Out-of-the-box reporting tools like Google Looker Studio, Power BI templates, or built-in CRM reports are fine as a starting point. But they’re designed for the average business, not your business. Here’s where custom dashboards pull ahead:
Relevance to Your Actual KPIs
Generic tools force you to work around their data model. A custom dashboard is built around yours, meaning every metric you see is one your team actually uses to make decisions.
Real-Time Data from Multiple Sources
Most businesses use a mix of platforms. A custom solution integrates them, pulling live data from Google Analytics, Xero, Shopify, Salesforce, or any API-connected tool, into a single view. No more logging into six dashboards before a Monday morning meeting.
Scalability
As your business grows, your reporting needs change. Custom dashboards are built to scale, add new data sources, new users, new metrics, without having to rebuild from scratch.
Better Decision-Making, Faster
When your leadership team has instant access to accurate, consolidated data, decisions happen faster and with more confidence. That’s a direct competitive advantage.
Reduced Manual Reporting
Automated data pipelines mean your team isn’t spending hours pulling reports. That time goes back into analysis, strategy, and execution.
Essential Dashboard Types Every Business Should Know
Not every business needs the same dashboard. The type you build depends on who’s using it and what decisions it’s meant to support. Here are the core categories we see most businesses benefit from.
Sales, Finance, and Operations Dashboards
Sales dashboards give your sales team and management a real-time view of pipeline health, revenue against targets, lead conversion rates, and individual rep performance. Instead of waiting for end-of-month reports, you can see exactly where deals are sitting and where the bottlenecks are.
Finance dashboards consolidate your P&L, cash flow, accounts receivable, and budget tracking in one place. CFOs and business owners get an accurate financial snapshot without waiting on the accounting team to manually compile figures. Integration with tools like Xero or MYOB makes this seamless.
Operations dashboards are built for businesses managing logistics, manufacturing, field teams, or service delivery. Key metrics might include SLA compliance rates, job completion times, inventory turnover, or workforce utilisation, all visible in real time so your ops team can act before issues escalate.
Marketing and Ecommerce Dashboards
Marketing dashboards centralise your campaign data across channels, Google Ads, Meta, email, SEO, and organic traffic, into a single performance view. You can track cost per lead, return on ad spend (ROAS), conversion rates, and channel attribution without toggling between platforms.
Ecommerce dashboards are built for online retailers who need to track orders, revenue, average order value, cart abandonment, and customer lifetime value in real time. Integrated with Shopify, WooCommerce, or custom platforms, these dashboards give your team the visibility to act quickly on inventory issues, underperforming products, or traffic drops.
Best Practices for Building a High-Impact Reporting Dashboard
A reporting dashboard is only as good as the thinking that goes into it. We’ve built dashboards for businesses across multiple industries, and a few principles consistently separate the ones that get used daily from the ones that get ignored after week two.
Start with the decision, not the data.
Before choosing which metrics to display, ask: what decisions does this dashboard need to support? Every chart, table, or KPI should trace back to a real business question. If you can’t explain why a metric is there, it probably shouldn’t be.
Keep it focused.
More isn’t better. A cluttered dashboard with 40 metrics is harder to read than one with 10 well-chosen ones. Design for clarity, your team should be able to scan it in under 30 seconds and know what needs attention.
Ensure data quality at the source.
A dashboard is only as reliable as the data feeding it. Before building, audit your data sources for consistency and accuracy. Garbage in, garbage out.
Build role-specific views.
Your CEO needs different information than your marketing manager or warehouse team. Role-based dashboards, or adjustable permission levels, ensure each user sees what’s relevant to them, not everything at once.
Set up alerts and thresholds.
Real-time data is most powerful when it tells you when something is wrong, not just what’s happening. Configure threshold-based alerts so your team gets notified the moment a KPI moves outside acceptable parameters.
Plan for iteration.
Your first dashboard won’t be your final one. Build in a review cycle, quarterly at minimum, to reassess which metrics still matter, add new data sources, and retire what’s no longer useful.
At AGR Technology, we follow a structured discovery process before writing a single line of code. We map your data sources, align on your core KPIs, and design a dashboard architecture that serves your team now and scales with you later.
Conclusion
If your team is still piecing together reports manually or making calls based on last month’s numbers, a custom digital reporting dashboard can change that, fast. You get real-time visibility, better decisions, and less time wasted on admin.
We build custom reporting dashboards for businesses of all sizes, from lean startups to enterprise teams managing complex data environments. Ready to turn your data into a genuine business asset? Get in touch with AGR Technology and let’s talk about what the right dashboard looks like for you.
More content:
Custom Data Dashboards for Analytics
AI Voice Agent Development Services
HR Data Dashboard Services: Turn Your Workforce Data Into Smarter Business Decisions
Data Analysis & Consulting for Trades Businesses

Alessio Rigoli is the founder of AGR Technology and got his start working in the IT space originally in Education and then in the private sector helping businesses in various industries. Alessio maintains the blog and is interested in a number of different topics emerging and current such as Digital marketing, Software development, Cryptocurrency/Blockchain, Cyber security, Linux and more.
Alessio Rigoli, AGR Technology